Revista Kawsaypacha: Sociedad y Medio Ambiente.
N° 7 enero – junio 2021. E-ISSN: 2709 - 3689
How to cite: Cachola, C. da S., & Pacca, S. A. (2021). The carbon footprint of Brazilian households through the Consumer Expenditure Survey (POF). Revista Kawsaypacha: Sociedad Y Medio Ambiente, (7), 11-27. https://doi.org/10.18800/kawsaypacha.202101.001
THE CARBON FOOTPRINT OF BRAZILIAN HOUSEHOLDS THROUGH THE CONSUMER EXPENDITURE SURVEY (POF)
Celso da Silveira Cachola
University of Sao Paulo. Sustainability Graduate Program, Associate
Sérgio Almeida Pacca
University of São Paulo. Sustainability Graduate Program, Associate
Professor
Abstract: The main objective of this article is to assess the carbon footprint of Brazilian families based on the Household Expenditure Survey (POF), 2008-2009, from the Brazilian Institute of Geography and Statistics (IBGE). The methodology used to quantify the Brazilian households’ carbon footprint has comprised three data sources: i) Household expenditure Survey, 2008-2009; ii) Leontief matrix of Brazilian accounts, year 2010; and iii) 2009 World Input-Output Database (WIOD) environmental inventory. Initially, an input-output (IO) model was created. Next, the results from the IO model were combined with the information of the POF. The poorest families, with a monthly income of up to $ 415.00, emit less than 1.5 metric tons per year, in contrast, the wealthiest families, with a monthly income above $ 5,187.50, release around 18.5 tons, almost 12 times more. It was found that an increase in income, results in an increase in CO2eq emissions. Thus, while the poorest families, which represent more than 20% of the total Brazilian families, cause 7% of the total emissions, the wealthiest families cause 16% of the total emissions although they represent only 4% of the total families. It was observed that the food category loses importance as income increases, while the opposite occurs in the services category. For the poorest families, there is great importance in the housing category, mostly caused by the consumption of electricity and LPG. Therefore, important measures for economic growth supported by actions become particularly relevant.
Keywords: Input–output analysis; Social disparity; Brazil carbon footprint.
La huella de carbono de los hogares brasileños a través de la Encuesta de Presupuesto Familiar (POF)
Resumen: El objetivo principal de este artículo es investigar la huella de carbono de las familias brasileñas, a través de la información de consumo, utilizando la Encuesta de Presupuesto Familiar 2008-2009, del Instituto Brasileño de Geografía y Estadística (IBGE). La metodología utilizada para cuantificar el enlace de carbono de la familia brasileña se realiza en base a tres fuentes: i. La encuesta de presupuesto familiar, 2008-2009; ii) La matriz de cuentas nacionales de Leontief, año 2010; y iii. El inventario ambiental de la base de datos de entrada y salida (WIOD) 2009. De esta manera, se realizó la creación de un modelo de entrada y salida. Este modelo produjo resultados promedio, considerando todas las regiones de Brasil. En consecuencia, las familias más pobres, con un ingreso mensual de US $ 415.00, emiten menos de 1.5 toneladas por año, mientras que las familias más ricas, quienes tienen un ingreso mensual de más de US $ 5,187.50, emiten 18.5 toneladas, casi 12 veces más. Con ello, se determinó que, al haber un aumento en los ingresos, se da también un aumento en la cantidad de CO2 emitido. Por lo tanto, mientras que las familias más pobres, las cuales representan a más del 20% del número total de familias brasileñas, emiten alrededor del 7% del número total de identificados, las familias más ricas emiten el 16% del número total de identificados, aunque solo representan el 4% del total de las familias. Se observó que la categoría de alimentos pierde importancia según el aumento de los ingresos, mientras que en la categoría de servicios ocurre lo contrario. Para las familias más pobres, la categoría de vivienda es de suma importancia, la cual se rige en gran medida por el consumo de electricidad y GLP. En tal sentido, las medidas de importancia para el crecimiento económico apoyadas por acciones se vuelven fundamentalmente relevantes.
Palabras claves: Análisis de entrada-salida; Disparidad social; Huella de carbono de Brasil.America.
Master student of the Sustainability Graduate Program at the University of Sao Paulo in Brazil, researcher in carbon footprint of Brazilian households, focusing on environmental and socioeconomic results (Input-output Analysis), with consideration in households’ consumption.
|
Pacca, Sergio Almeida Associate professor in the undergraduate program in Environmental Management at the School of Arts, Sciences, and Humanities (EACH) at the University of São Paulo (USP), and in the graduate program in Sustainability (PPGS-USP), Researcher in the areas of energy, sustainability, global climate change, life cycle assessment (LCA), and industrial ecology. Email: spacca@usp.br https://orcid.org/0000-0001-7609-5139 |
1. Introduction
The current condition of the planet is of concern to those who pay attention to actual evidences. In addition to the disappearance of wetlands and the risks of biodiversity loss, alarming levels of carbon dioxide (CO2) emissions threaten the climate system, coral reefs and the ice sheets of Greenland and Antarctica (Moran 2010).
According to the Intergovernmental Panel on Climate Change (IPCC), the increase in the concentration of Greenhouse Gases (GHG) through anthropogenic action enhances the greenhouse effect (IPCC, 1990). The CO2 concentration has reached 416.39 ppm in 2020, and is increasing 2 ppm per year (Global Monitoring Laboratory 2020; Martínez-Alier 2012; Steffen et al. 2015).
By 2017, human’s forcing had probably caused global warming by approximately 1 °C and its influence on the climate has been the dominant cause of warming observed since the mid-20th century. The rise in temperature to date has already resulted in profound changes in the human and natural systems, causing risks for the most vulnerable people and populations (IPCC 2018).
Meanwhile, emissions of the main GHGs continue to grow due to the increase in the metabolic flows of the economy. In recent years, there have been several attempts at global governance to reduce emissions, such as the Kyoto Protocol, the Copenhagen COP 15, and more recently the Paris Agreement, but no policy has achieved very satisfactory results (Jayaraman 2015; Martínez-Alier 2012). However, the Paris Accord, which aims to keep the global temperature within a 2° C increase from the temperature measured in 1850, requires an aggressive decarbonization of rich countries and limits the aspirations of developing countries (Hubacek et al. 2017a).
If reducing CO2eq emissions is not achieved, climate change is expected to have negative effects on nature and society. But we can go beyond international agreements to mitigate CO2eq emissions. A good solution may come about with the quantification of GHG emissions through consumption and voluntary and autonomous mitigation actions (Sköld et al. 2018).
The study on consumption, by individuals or households, strongly refers to climate justice which should be considered by policy makers targeting equity and climate goals. Climate justice should guide the choice of mitigation tools and public policies, such as, for example, taxation on carbon emissions (Feng et al. 2021).
Few efforts have been made to quantify the differences in carbon footprint (CF) associated with domestic consumption in low and middle income countries, such as Latin American countries (Zhong et al. 2020).
Therefore, the main objective of this work was to investigate quali-quantitatively the CF of Brazilian households, through consumption information, using the Consumer Expenditure Survey (POF), 2008-2009, of the Brazilian Institute of Geography and Statistics (IBGE) as the basis. The latest available POF data was for 2008-2009. It was used in this assessment because the tables were released by the IBGE’s Automatic Recovery System (SIDRA). Data from the most recent survey have not yet been released in tabular form on the same system.
This article includes introduction, the theoretical framework, the methodology used to quantify the CF of Brazilian households, the results, discussions, and conclusions.
2. Background
In recent years, the CF has become relevant in the public discussion on climate change, attracting consumers, companies, governments, NGOs and international organizations, such as the think tank EcoEquity, etc. (Ecoequity 2020; Minx et al. 2009). Although the term CF is new, the framework for its calculation has been developed over a long period of time. For example, the CF of any product refers to a Life Cycle Assessment (LCA) and LCAs on domestic impacts are dispersed in different media, such as journals, book chapters, conference proceedings, patents, etc. (Minx et al. 2009; Spreafico & Russo 2020).
With their focus on direct and indirect emissions associated with a specific final demand, CFs are very intuitive for input – output (IO) practitioners. The use of input – output models (IOMs) can be used to understand consumption and lifestyle patterns, thus providing tools for CF. Unfortunately, it is accepted that deep cuts in carbon emissions are likely to come not only from technological changes, but also from changes in consumer compartment and lifestyles. In an IOM, a «lifestyle» is usually referred to the spending pattern of a group of people or families, like this paper (Arbex & Perobelli 2010; Minx et al. 2009).
Globally it is estimated that family consumption is responsible for more than 72% of GHG emitted worldwide. These emissions tend to increase in the near future, until 2050, due to population growth and access to better living conditions, but little is known about the patterns of such emissions, its driving factors, and the global emissions triggered by consumption in these regions (Dubois et al. 2019; Minx et al. 2013).
In this way Jones & Kammen (2011) created a study supported by a mathematical model based on household consumption, including GHG emissions during the extraction, manufacturing, transportation, use, and disposal phases of goods. The same was done with data from 28 cities and 12 income groups, totaling over 2,000 different household types surveyed.
The study concludes that an American family, on average, totaled 48 tons of CO2eq emissions per year. The categories with more responsibility for emissions were transport, housing, and food, respectively. In the United States of America (USA), GHG emissions associated with household consumption are estimated to represent more than 80% of the total. Thus, there has been a significant increase in information campaigns promoting low-carbon lifestyle choices to reduce total GHG emissions (Jones & Kammen 2011).
Similar to the study of the CF of US households, an average Norwegian household spent $ 89,000 per year on the consumption of goods and services in 2012 and an analysis between 2009 and 2012 has found that there was an increase in consumption in 2012 compared to 2009 accompanied by an increase in CO2eq emissions as well. In 2012, a CF of 22.3 tons was found, an increase of 26% since 1999 (Steen-Olsen et al. 2016).
Another study has indicated that a German family, with an annual demand of € 35,000, emits 30 tons of CO2eq annually, but unlike American families, the category with the highest emission share was housing, followed by transport (Miehe et al. 2016).
As can be seen, there is a great demand from families for carbon, whether European or American. However, the values change according to their lifestyle and income level. In the study by Jones & Kammen (2011), for example, one can observe the disparity of CF by income and family size. The higher the family’s income and size, the higher their respective CF.
As we expand this reasoning to a global scenario, there are big differences in the CF between the poor and the rich. On average, for the lowest income bracket the CF is equal to 1.6 tons per year, while the average CF for higher income people is 17.9 tons per year (Hubacek et al. 2017a).
Globally, the richest 10% were responsible for 36% of GHG emissions, while the poorest 50% emitted only 15% of total emissions. The increase in income consequently leads to an increase in the CF, making it difficult to achieve global GHG emissions mitigation targets (Hubacek 2017b).
It should be noted that all member states of the United Nations have adopted the 2030 Agenda and the Sustainable Development Goals (SDGs). This describes a universal agenda that must be applied and implemented by all countries, whether developed or developing. Eradicating poverty and thriving economic growth will certainly require greater carbon demand (Hubacek 2017b; United Nations, 2017).
It will be necessary to create quality jobs that benefit from opportunities that stimulate the economy without inflicting damage to the environment. This requires improvements in current technologies and behavioral change, such as switching from fossil fuels to renewable energy, the production of goods with a longer useful life, the reduction of unnecessary waste and the switch from animal to vegetable products (O’Neill et al. 2018; United Nations 2018b). Families can save immense amounts of carbon, for example, changing their diet to avoid meat or stop traveling by plane. Behavioral changes may reduce CO2eq exemption more than the provision of policies in the Paris Agreement (Arbex & Perobelli 2010; Dubois et al. 2019; Minx et al. 2009).
Finally, applying the method to a developing country, such as Brazil, might trigger other debates as well such as the evaluation of climate and equity goals in climate policies.
3. Methodology
3.1 Calculation of Carbon Footprint (CF)
The calculation of the CF was made with the sum of the indirect and direct emissions of each income group, according to the equation (1). The results of the input-output model are expressed in metric tons of CO2eq per year.
3.2 Calculation of Indirect Emissions (IE)
The quantification of the Brazilian family indirect emissions (IE) was done using three information sources: Family budget survey (POF), 2008-2009 and 2010 Leontief Matrix from the IBGE, and the 2009 Environmental inventory from the Word Input-Output Database (WIOD).
Basically, IE can be estimated based on household consumption. Thus, in this work we have used the average values of family consumption, by income groups, supplied by the POF. The total household IE is the sum of emissions by each POF acquisition sector. The IE is the result of summation product of national account Leontief Matrix (L), environment coefficient (Ce) and expenditure by sector (E). The result of IE will be given by each income group (IG), according to equation (2).
The Lentief´s model was provided by IBGE, starting from an input-product matrix of the National Accounts. The input-output matrix shows how much a given economic activity needs to consume from other activities to produce an additional unit. In 2010, the Brazilian input-output matrix was made available in 3 levels: 12, 20, 67 (IBGE 2010, 2015). The higher the level, the greater the detail of the same because the level means the dimension of the matrix.
In this research, we used the level 67 matrix, represented in the equation (3).
The data of the Brazilian Leontief Matrix were multiplied with the POF consumption monetary data, according to the equation (4). In this stage, the average consumption per income group was allocated according to the 67 activities of the National Accounts. The description of the consumption searched items by POF follows the methodology of the Classification of Individual Consumption According to Purpose (COICOP), prepared by the United Nations Statistics Division (United Nations 2018a). To correlate the consumption items with the activities of the national accounts, the codes of the National Classification of Economic Activities (CNAE) (IBGE 2015) were considered.
The last step to obtain indirect CO2eq emissions was multiplying the matrix data, created by the correlation described above, by the environmental coefficients. The environmental coefficient was obtained by dividing the environmental inventory data (WIOD 2013) by the total production data in 2010 (IBGE, 2010), according to the equation (5). It was also necessary to relate the activities of the Brazilian Leontief Matrix to the sectors of the WIOD.
The total IE by income group is the sum of emissions for each category, as described initially in this section.
3.3 Calculation of Direct Emissions (DE)
The direct emissions (DE) were calculated through monthly expenditure on fossil fuels, electricity, natural gas (NG), and Liquefied Petroleum Gas (LPG). The calculation of direct emissions follows a pattern, where the amount of household consumption was first calculated through POF data. Thus, the monetary value spent on a given item (C) is divided by its average price on the date of the survey (P). Then, as the quantity of the item that was consumed is determined, it is multiplied by the CO2eq emission factor (EF), according to equation (6). The value of direct emissions is the sum of the emission of the items described above.
The unit prices of gasoline and diesel, used mainly in Brazilian public transport, and their respective emission factors were extracted from the First National Inventory of Atmospheric Emissions by Road Vehicles (MMA 2011). Direct emissions due to electricity consumption were determined through the emission factor, made available by the Ministry of Science, Technology and Innovations (MCTIC), with the average nominal value of the electricity fare (Aneel & Carvalho 2019; MCTIC 2020).
3.4 Consumer Expenditure Survey (Pesquisa de Orçamento Familiar –
POF)
The POF 2008-2009 investigated a sample of 55,970 households in all Federative units in Brazil between 2008 and 2009 (IBGE 2011). The survey did not address the household CF, but investigated household expenses, thus allowing the creation of the IOM from them.
The survey has aimed to measure the structure of consumption, spending, and income. The sampling was designed in such a way as to enable the publication of results at different regional levels (IBGE 2011).
Consumption expenditure corresponds to the expenditure made by households to purchase goods and services used to meet their personal needs. The surveyed categories were food; housing; clothing; transport; personal hygiene and care; health care; education; recreation and culture; smoking; personal services; and miscellaneous expenses (IBGE 2011).
The POF also surveys income, which is decisive for socioeconomic assessments. Through these data it is possible to analyze jointly the expenses of Brazilian families (IBGE 2011). The survey forms used in the POF were the following:
3.5 Conversion from Brazilian reals to dollars
According to the Institute of Applied Economic Research (IPEA), in 2009 $ 1.00 dollar was equivalent to R$ 2.00 (IPEA 2020). This exchange rate was used to convert values in Brazilian Reals from the POF into dollars.
4. Results and Discussion
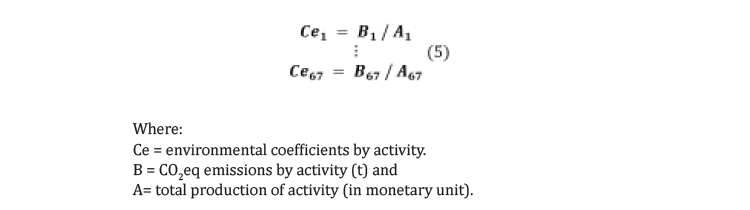
The input-output model produced standard, i.e. average, results for all regions of Brazil. As already mentioned, a sample of 55,970 households was interviewed through the POF. The families were divided into six income ranges and Figure 1 shows the family CF by monthly income class. While each of the poorest families emit less than 1.5 metric tons per year, each of the richest families emit about 18.5 tons, or almost 12 times more.
Thus, one can notice the disparity of Brazilian family emissions that arises from the economic inequality experienced in the country for a long time (Hubacek et al. 2017a; Wood & Carvalho 2009).
The total emissions of Brazilian families in 2009 were equivalent to 77% of total Brazilian emissions according to the WIOD environmental inventory. This value was well close to the value of Jones & Kammen (2011), in which 80% of U.S. emissions were due to household consumption.
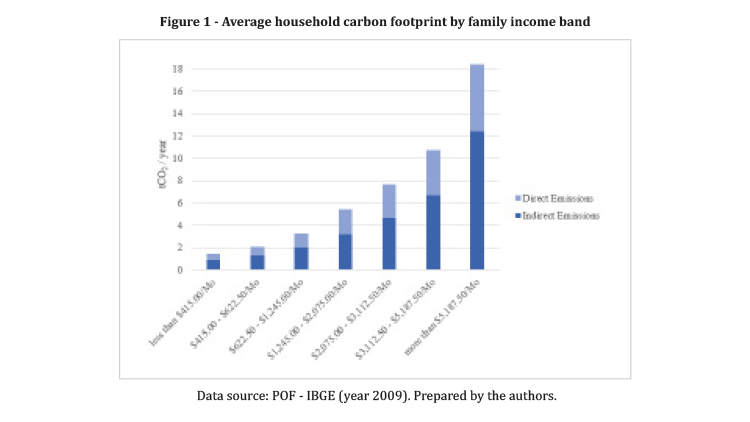
There is a disparity in the CO2eq emissions of Brazilian families. As mentioned by Hubacek et al. (2017a), the richest emit more than the poor. The CF of Brazilian families follows this emission pattern. While the poorest families, which represent more than 20% of all Brazilian families, emit about 7% of total emissions, families with income above $ 5,187.50 emit 16% of total emissions, and only represent 4% of all families. Figure 2 illustrates this outcome.
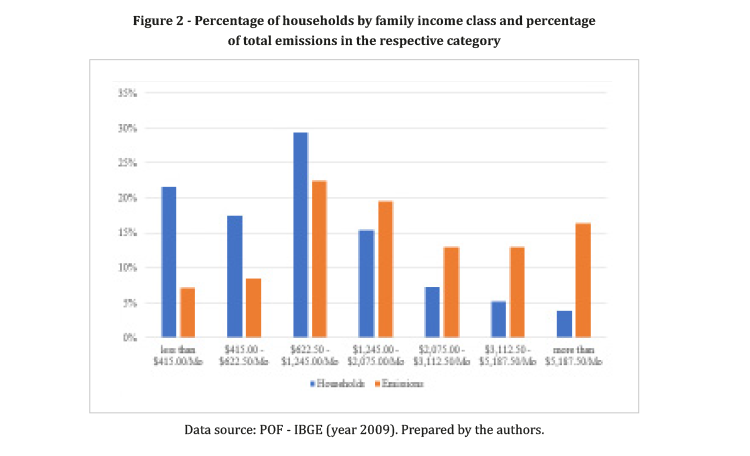
Figure 3 shows the ratio of monthly family income to the volume of the respective CF. It resembles a basic linear regression, showing that an increase in income implies an increase in the amount of CO2eq emitted. The value of R² was equal to 95%, which certainly demonstrates the high relationship between income and emissions. Households with low income have a CF per year much lower than the CF of wealthy households. Thus, as there is an increase in income, there will certainly be an increase in the CF.
Also, it can be considered that richer households should adopt measures to reduce their CF. These measures should include a change in lifestyle, such as reducing the consumption of unnecessary goods and services and substituting vegetarian for meat based diets (O’Neill et al. 2018). Other income classes should also look at their emissions, but to a lesser extent than wealthy households.
Similar to the work of Jones & Kammen (2011), the categories with the highest emission shares were transportation and housing. In the analysis of Brazilian CF, both categories have direct emissions, with the use of fossil fuels in motor vehicles (transport) and use of electric power and cooking gas (housing). Despite having an energy matrix with a predominance of the use of renewable sources, the electric energy has as average annual emission factor of 0.0246 tons of CO2eq /MWh (MCTIC 2020).
In this paper, we divided emissions into 5 categories:
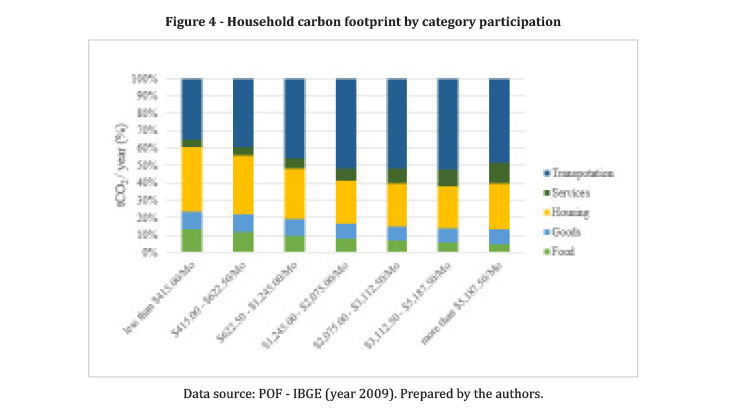
Figure 4 shows the contribution of the main emission categories. It can be observed that the food category loses importance as there is an increase in income, while the services category is the opposite. For the poorest families, there is a great importance of the housing category, due to the consumption of electricity and LPG, important items for the maintenance of human well-being.
Transportation is the category with the greatest influence of Brazilian families’ emissions. For the construction of low carbon scenarios to reduce CO2eq emissions, the use of bioenergy is an alternative usually considered. Brazil is a reference in the global agro-energy market, making the expansion of ethanol use in light vehicles a viable option for low-carbon transportation (Camargo et al. 2019).
It is noteworthy that the development of vehicles in Brazil with flex-fuel technology, which run on both gasoline and ethanol, offered an economic and ecologically more sustainable alternative for families. In addition, electric vehicle technology, which already exists in the foreign market, in the future can provide a fleet of new vehicles to serve the population of large cities in Brazil (Camargo et al. 2019).
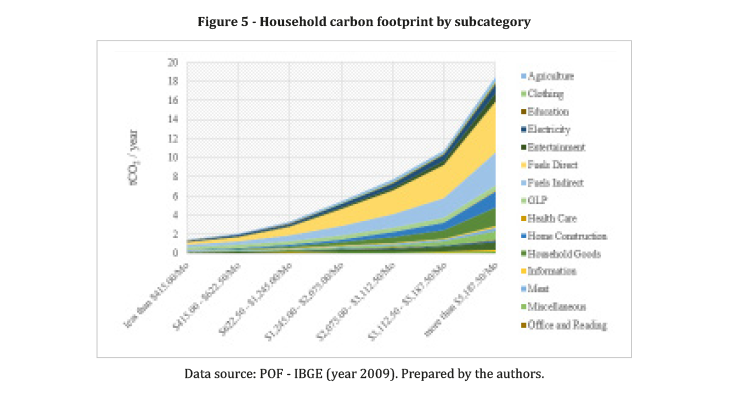
Figure 5 displays the emissions by subcategories. The importance of direct and indirect emissions caused using personal vehicle fuels is observed again. Therefore, the creation of public policies for the transport sector aiming at a transition to low carbon futures is evident. One should also invest in the railway model, since there is a large volume of indirect emissions caused by freight.
5. Suggestions for future Works
A study of the environmental footprint through consumption is also of great relevance. Thus, as suggestions for future work include the analysis of indirect water use, land use, energy, and materials, it is also possible to study the evolution of the CF of Brazilian families using POF data 2017-2018, however these data were not made available in tabular form by IBGE, thus avoiding its analysis in a timely manner.
6. Conclusions
This work showed the CF of Brazilian households. The study proves to be important because it accounts for Brazilian emissions by household consumption in an indirect and direct way, a topic that is still little addressed in Brazil and in developing countries.
The input-output model showed a disparity between the emissions of developing countries against Brazilian results, but also showed the national disparity of CF of Brazilian households. While a poor family emits less than 2 tons/year of CO2eq, a rich family emits almost 12 times more.
The carbon emissions of households have been shown to be lower than those of developed countries, however, there is a great disparity between income groups. As shown in Figure 2, the richest households, which represent a small part of the Brazilian total (4%), emit 16% of all family emissions. On the other hand, households that have a monthly income of up to $ 415.00 and represent 22% of all Brazilian households, emit only 7% of total emissions. Thus, one can conclude that few emit a lot, and many emit little. Thus, with the persistent socioeconomic inequality in Brazil, the carbon equity in the country is challenging.
However, the change in lifestyle, such as a food change, giving preference to products of plant origin, greater use of public transport, which is already the choice for the poorest, and the use of ethanol and electricity vehicles in the future, can decrease the CF of the wealthiest families. In a macro scenario, there are other factors relevant to the reduction of CF, such as the decrease in cargo transport with diesel trucks, investing in biofuels in this vehicle category. Thus, public policies to reduce vehicular GHG and electricity emissions combined with renewable energies become of great relevance.
It is also possible to propose initiatives such as the carbon tax, if it is carried out progressively, without penalizing the poorest to avoid generating more inequality. The most polluting industrial sectors would move to cleaner technologies and the amount paid with the tax could be invested in cleaner projects.
Finally, other possible tools to help decrease the CF of Brazilian household would be the availability of a CF calculator and information on CO2eq emissions on the labels of the products purchased. A combination of individual actions and public policies will certainly reduce the CF of Brazilian households, even though it is already small when compared to other countries.
References
Aneel, & Carvalho, C. E. (2019). Evolução de Custos , Mercado e Tarifas Panorama Brasil. Retrieved from http://legis.senado.leg.br/sdleg-getter/documento/download/5d41412c-19f3-41cb-ab61-4dc767a6cf59
Arbex, M., & Perobelli, F. S. (2010). Solow meets Leontief: Economic growth and energy consumption. Energy Economics, 32(1), 43–53. https://doi.org/10.1016/j.eneco.2009.05.004
Camargo, A. T., Simões, A. F., & Pacca, S. A. (2019). O potencial de mitigação da mudança climática dos vetores energéticos da cana-de-açúcar na frota paulistana de veículos leves. Revista Tecnologia e Sociedade, 15(37), 516–528. https://doi.org/10.3895/rts.v15n37.9791
Dubois, G., Sovacool, B., Aall, C., Nilsson, M., Barbier, C., Herrmann, A., … Sauerborn, R. (2019). It starts at home? Climate policies targeting household consumption and behavioral decisions are key to low-carbon futures. Energy Research and Social Science, 52(September 2018), 144–158. https://doi.org/10.1016/j.erss.2019.02.001
Ecoequity (2020). About Ecoequity. Retrieved July 24, 2020, from https://www.ecoequity.org/about/
Feng, K., Hubacek, K., & Song, K. (2021). Household carbon inequality in the U.S. Journal of Cleaner Production, 278, 123994. https://doi.org/10.1016/j.jclepro.2020.123994
Global Monitoring Laboratory (2020). Trends in Atmospheric Carbon Dioxide. Retrieved July 24, 2020, from https://www.esrl.noaa.gov/gmd/ccgg/trends/
Hubacek, K., Baiocchi, G., Feng, K., Muñoz Castillo, R., Sun, L., & Xue, J. (2017a). Global carbon inequality. Energy, Ecology and Environment, 2(6), 361–369. https://doi.org/10.1007/s40974-017-0072-9
Hubacek, K., Baiocchi, G., Feng, K., & Patwardhan, A. (2017b). Poverty eradication in a carbon constrained world. Nature Communications, 8(1), 1–8. https://doi.org/10.1038/s41467-017-00919-4
IBGE (Brazilian Institute of Geography and Statistics) (2010). Sistema de Contas Nacionais - SCN. Retrieved July 14, 2020, from https://www.ibge.gov.br/estatisticas/economicas/comercio/9052-sistema-de-contas-nacionais-brasil.html?edicao=18363&t=downloads
IBGE (2011). Pesquisa de Orçamentos Familiares: 2008-2009. Análise do Consumo Alimentar Pessoal no Brasil. In Biblioteca do Ministerio do Planejamento, Orçamento e Gestão. https://doi.org/ISSN 0101-4234
IBGE (2015). Matriz de insumo-produto: Brasil. Rio de Janeiro.
IPCC (Intergovernmental Panel on Climate Change) (1990). Climate change: the IPCC scientific assessment. In Climate change: the IPCC scientific assessment. https://doi.org/10.2307/1971875
IPCC (2018). Framing and Context. In Global Warming of 1.5 oC (pp. 47–92). https://doi.org/10.1017/CBO9781107415324.004
IPEA (Applied Economic Research) (2020). Salário mínimo nominal vigente. Retrieved July 10, 2020, from http://www.ipeadata.gov.br/ExibeSerie.aspx?stub=1&serid1739471028=1739471028
Jayaraman, T. (2015). The Paris Agreement on Climate Change: Background, Analysis and Implicattions. Review of Agrarian Studies: RAS. https://doi.org/10.1017/CBO9781107415324.004
Jones, C. M., & Kammen, D. M. (2011). Quantifying carbon footprint reduction opportunities for U.S. households and communities. Environmental Science and Technology, 45(9), 4088–4095. https://doi.org/10.1021/es102221h
Martínez-Alier, J. (2012). Environmental justice and economic degrowth: An alliance between two movements. Capitalism, Nature, Socialism, 23(1), 51–73. https://doi.org/10.1080/10455752.2011.648839
MCTIC (Ministry of Science, Technology and Innovations) (2020). Fator médio - Inventários corporativos. Retrieved July 13, 2020, from http://www.mctic.gov.br/mctic/opencms/ciencia/SEPED/clima/textogeral/emissao_corporativos.html
Miehe, R., Scheumann, R., Jones, C. M., Kammen, D. M., & Finkbeiner, M. (2016). Regional carbon footprints of households: a German case study. Environment, Development and Sustainability, 18(2), 577–591. https://doi.org/10.1007/s10668-015-9649-7
Minx, J., Baiocchi, G., Wiedmann, T., Barrett, J., Creutzig, F., Feng, K., … Hubacek, K. (2013). Carbon footprints of cities and other human settlements in the UK. Environmental Research Letters, 8(3). https://doi.org/10.1088/1748-9326/8/3/035039
Minx, J. C., Wiedmann, T., Wood, R., Peters, G. P., Lenzen, M., Owen, A., … Ackerman, F. (2009). Input-output analysis and carbon footprinting: An overview of applications. In Economic Systems Research (Vol. 21). https://doi.org/10.1080/09535310903541298
MMA (2011). 1° Inventário Nacional de Emissões Atmosféricas por Veículos Automotores Rodoviários. 114.
Moran, E. F. (2010). Environmental Social Science: Human-Environment Interactions and Sustainability. https://doi.org/10.1002/9781444319057
O’Neill, D. W., Fanning, A. L., Lamb, W. F., & Steinberger, J. K. (2018). A good life for all within planetary boundaries. Nature Sustainability, 1(2), 88–95. https://doi.org/10.1038/s41893-018-0021-4
Sköld, B., Baltruszewicz, M., Aall, C., Andersson, C., Herrmann, A., Amelung, D., … Sauerborn, R. (2018). Household preferences to reduce their greenhouse gas footprint: A comparative study from four European cities. Sustainability (Switzerland), 10(11). https://doi.org/10.3390/su10114044
Spreafico, C., & Russo, D. (2020). Assessing domestic environmental impacts through LCA using data from the scientific literature. Journal of Cleaner Production, 266. https://doi.org/10.1016/j.jclepro.2020.121883
Steen-Olsen, K., Wood, R., & Hertwich, E. G. (2016). The Carbon Footprint of Norwegian Household Consumption 1999–2012. Journal of Industrial Ecology, 20(3), 582–592. https://doi.org/10.1111/jiec.12405
Steffen, W., Richardson, K., Rockström, J., Cornell, S. E., Fetzer, I., Bennett, E. M., … Sörlin, S. (2015). Planetary boundaries: Guiding human development on a changing planet. Science, 347(6223). https://doi.org/10.1126/science.1259855
United Nations (2017). Global responsibilities: International spillovers in archiving the goals. SDG Index and Dashboards Report 2017, 396. https://doi.org/10.1016/S0140-6736(09)61513-0
United Nations (2018a). COICOP Revision. Retrieved July 14, 2020, from https://unstats.un.org/unsd/class/revisions/coicop_revision.asp
United Nations (2018b). World economic and social survey 2018: frontier technologies for sustainable development.
WIOD (World Input-Output Database) (2013). Environmental Accounts. Retrieved July 14, 2020, from http://www.wiod.org/database/eas13
Wood, C. H., & Carvalho, J. A. M. de. (2009). The Demography of Inequality in Brazil (Digitally). Cambridge University Press.
Zhong, H., Feng, K., Sun, L., Cheng, L., & Hubacek, K. (2020). Household carbon and energy inequality in Latin American and Caribbean countries. Journal of Environmental Management, 273(September), 110979. https://doi.org/10.1016/j.jenvman.2020.110979
Revista Kawsaypacha: Sociedad y Medio Ambiente.
N° 7 enero – junio 2021. E-ISSN: 2709 - 3689
How to cite: Cachola, C. da S., & Pacca, S. A. (2021). The carbon footprint of Brazilian households through the Consumer Expenditure Survey (POF). Revista Kawsaypacha: Sociedad Y Medio Ambiente, (7), 11-27. https://doi.org/10.18800/kawsaypacha.202101.001